My wife and I bought our first house this year and one of the most important things to us was location. We like being close to good dining and retail, and I bike to work downtown. There are a few nice neighborhoods close to downtown and one that is definitely seeing a huge revitalization is Merion Village.
The neighborhood center is approximately two miles south of downtown Columbus, Ohio and is generally bordered by German Village on the north, the Scioto River on the West, Parsons Avenue on the east, and Hungarian Village on the south.
Property Types in Merion Village
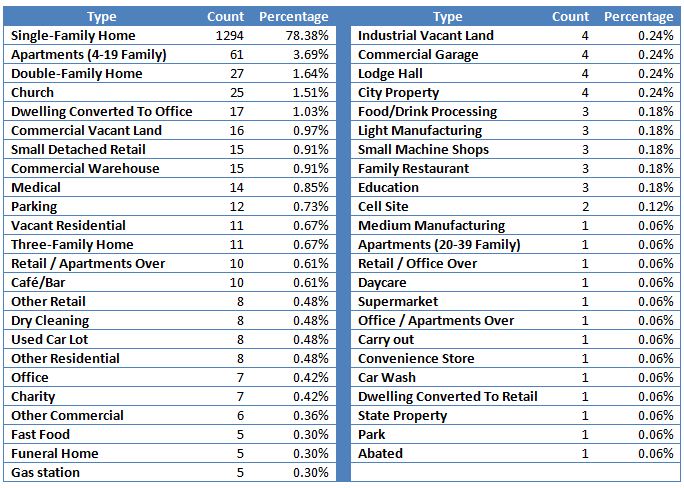
The neighborhood is primarily residential, although there are some pockets of commercial properties. The two main streets on the east and west are also heavily commercial. This table gives the specific breakdown of the property types.
(If you want this data in simple text format, click here (CSV).)
Using the geocoded data from the dataset, I was able to plot the points on an XY grid that corresponds to a map. I simplified the categories and removed all but the main roads for this map.
Age of properties in Merion Village
Merion Village is a relatively old neighborhood for the city, with many properties dating to the early 20th century.
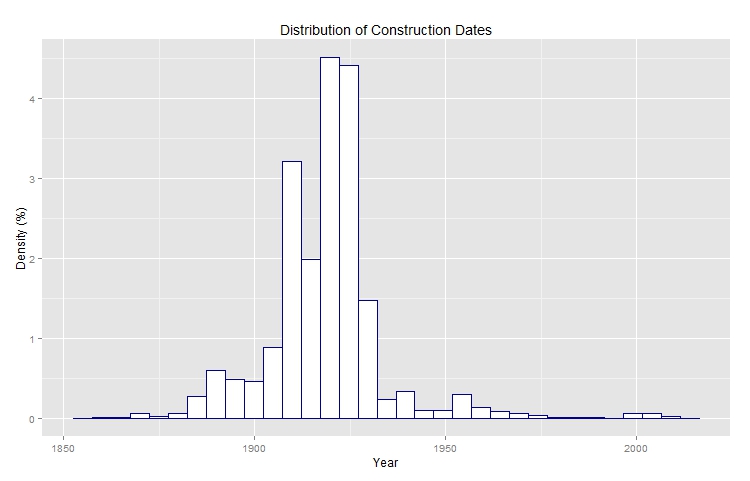
This is a distribution of the construction dates:
The construction dates on many homes are not known and, unfortunately, this isn’t always coded properly in the data. Some values are blank and some are marked as “OLD”. Additionally, there is a record-keeping quirk where at some point the year 1910 was generically used for any unknown date prior to 1920. This explains the spike at 1910.
This map shows the construction dates of properties. Of interest is the northwest corner with a lot of pre-1900 homes.
Merion Village Property Values
Because of the various property types, all of my analysis on property value was done just on single family homes. The value I used is the land value plus the structure value.
The median property value was $122,300. The neighborhood tends to be a little bit hit-or-miss. Some properties are essentially dilapidated, but others are extremely well-maintained. Some properties are worth less than $10K, while others are in the $400K range.
Here is the distribution of the property values:
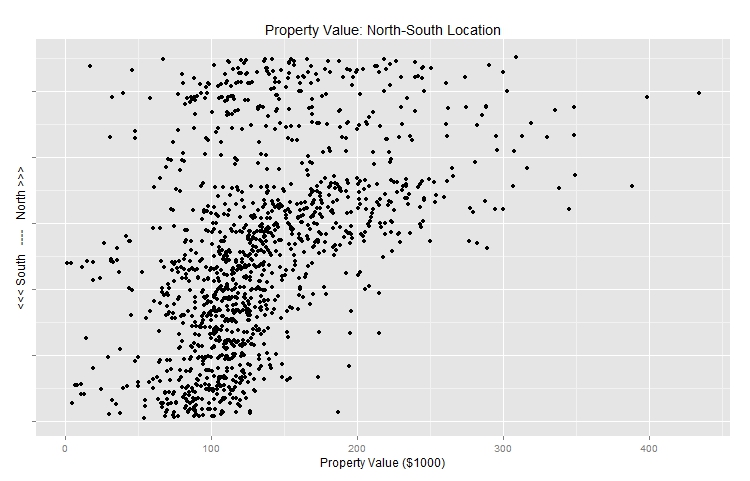
Intuitively, I knew that the houses closer to the north (German Village) would be more valuable. I also assumed that the properties more east or west would be less valuable as they are closer to the commercial areas of the neighborhood.
To get a better feel for this, I plotted the property values compared both their North-South and East-West location. The North-South correlation is loose, but obvious, whereas the East-West correlation is much less pronounced. You can see a slight dip on the east and west extremes, but not much variation in the middle.
Finally, I plotted these values on the map in a similar fashion to the map above.
Data
Some notes on the data:
The data comes exclusively from the Franklin County Auditor’s website, but they have two different tools to download data. For some reason, the Web Reporter does not include the neighborhood or “Auditor Map” data that was critical in filtering out properties. On the other hand, the Download Manager does not include the x-y positional data included in the Web Reporter! I manually combined these data sets in SQL and then removed the duplicate columns.
A (mostly) complete explanation of the fields is available here (PDF) through the auditor.
I added the following columns:
- luse_cat: A text field describing the general land use
- yearblt_int: A numeric field representing the year the property was built
- tranyear: A numeric field representing the year of the most recent transaction (trandt)
The rows were culled mostly manually so there may be a few stray properties that were removed erroneously or some that are incorrectly in the data set. Additionally, I intentionally did not include a large swath of land in the southwest of the neighborhood. This land is mostly empty and industrial use and I felt it was not relevant to this presentation.
The data used was the most recent data set available, which is from October 2012.
References
- Franklin County Auditor Data Library
- Franklin County Auditor Web Reporter
- ggplot2 Most of the plots on this page were produced using this wonderful library for R.
- Google Maps All maps were produced with Google Maps. I manually removed the layers not shown.
- Map of Merion Village


