
Some of my favorite television shows are those with ensemble casts. I feel that a large cast keeps the episodes fresh and makes it hard to tire of a particular character since every character is just a small piece of the larger television show universe. One of the more popular ensemble cast shows on right now is Downton Abbey. I really wanted to see how the characters fit together graphically, so I made this social network graph using Python and D3.
(Click here for a larger version)
The data I used was the (unofficial) episode transcripts available here. I used Python to parse each script and count a few pieces of data. The most important is how many times character X is also in a scene with character Y. I excluded characters who appeared in fewer than ten scenes. Next I used Python to generate the JSON data that is fed into this visualization.
Although it took a lot of tweaking to get the details right, the graph instantly showed some interesting character relationships.
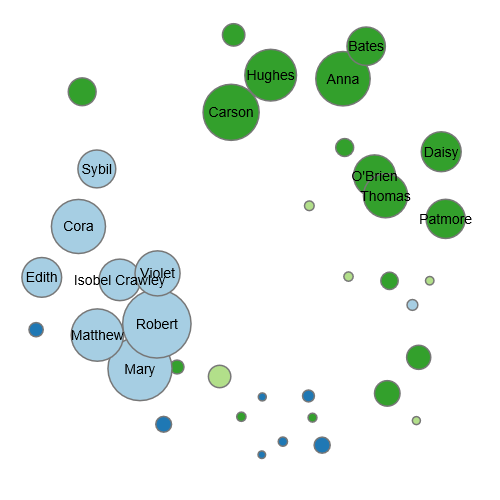
To me the most interesting are the character pairs of the series. Matthew and Mary, O’Brien and Thomas, and Carson and Hughes are each closely linked. However, there are a few important “conceptual” relationships that aren’t actually present in terms of on-screen presence. Notice that Robert and Cora aren’t actually that close nor are Bates and his wife Vera. In both cases it is because Cora and Vera share their on-screen presence relatively evenly with other characters.
The graph also shows the relative bundling of the Upstairs and Downstairs.
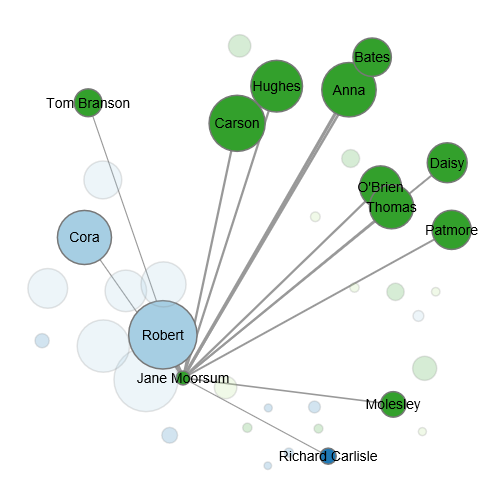
A few interesting outliers are Tom Branson who is linked with Sybil and Jane Moorsum, the maid who becomes romantically involved with Robert. Carson, of course, is in the middle of it all and is the closest to the family of all the staff. In contrast, Daisy and Bates are pushed the farthest from the family. This might seem odd for Bates, but I believe it is because his only close relationship to the family is Robert–he has very little screen time with other Granthams. One other interesting character is Moseley who is not tied to any particular group but instead has loose links with almost everyone.
Note that the D3 algorithm for generating the graph only uses shared screen time as a guide for building the graph. Your specific view will be different from these images, but the same general themes should be present. Finally, my code made use of these two D3 examples: Chicago Lobbyists by Christopher Manning and Les Mis Force Directed Graph by Mike Bostock.
Hi
I am doing a projct on your graph but needed to know the rank of it. Do you know?
Thanks!
Caroline
I’m not familiar with that term. What do you mean by the “rank” of the graph?