
Maybe it was Stats 101 or a psych class or a business class, but if you had to learn about any statistical testing in school, you probably learned about the Student’s t-test, or just “t-test” for short.
The test sounds very useful. Suppose I have a set of data set of observations that come from two different populations. I then calculate the average for each of those populations and I notice the average of one population is higher than the other. The t-test will tell me how likely I am to have gotten the observations given that the two populations are not different. In other words: do I have a statistically meaningful result?
When you learned about this test, you probably took a small data set of numbers, ran through the arithmetic, looked up some numbers in a table and concluded that the populations either are different or the same. The test is so pervasive, it’s even built into Excel with the TTEST function. Unfortunately there are several (often-forgotten) assumptions of t-test that often make it the wrong test to use!
Are real name YouTube commenters less profane?
YouTube recently started rolling out Google+ integration for users to use their real names on the site. This is one of many changes they are working on to improve to awful quality of YouTube comments. I hypothesized that real name users are less likely to use profanity.
To test this, I used the YouTube API to gather about 7500 comments and information about the comments’ authors to determine if they are real name or username users. (Check out my post on web scraping with BeautifulSoup for more details.) Finally, I counted uses of about 30 profane words and variations in the comments.
My data showed that real name commenters use a profanity for every 1 out of 60 words and username commenters use a profanity for every 1 out of 54 words. (Side note: The most profane comment with a whopping 1:3 profanity rate was by real name user Elijah Morrison: “Okay? let me get this FUCKING STAIT, the thing that i have been waiting for this whole time is some fucking bullshit i dont even understand? WHAT THE FLYING FUCK I THOUGHT THEY WERE GONNA REVEAL THEY WERE TRYING TO MIND CONTROL US OR SOME SHIT! FUCKING FUCK FUCK FUCKING BULLSHIT FUCKIN WAIST OF TIME ASS FUCKK FUCKIN FUCK!!!”)
When I run a t-test on the data, I am given a p-value of 0.2924 which means there is a 29% chance I would have gotten these results if there is no difference between real name and username commenters’ profanity rates. But a t-test is the wrong test to use because my data does not meet the assumptions of the t-test!
The t-test makes six assumptions, but I want to focus on the normality assumption. For the t-test to work, your data should be pretty close to normally distributed, i.e. in a bell curve. The YouTube comment data is not normal. Thankfully, there are statistical tests that do not assume a normal distribution known as “non-parametric” tests. The non-parametric counterpart of the t-test is the Mann-Whitney U test. Because my data meets the assumptions of the Mann-Whitney test, I can use it. The result is a p-value of 0.0015 which means there is a 0.1% chance that I would have gotten these results if there were no difference between username and real name commenters.
When to use the Mann-Whitney test
Here’s a very manageable dataset showing some physical data of students before and after a health class. This is a distribution of weight by sex:
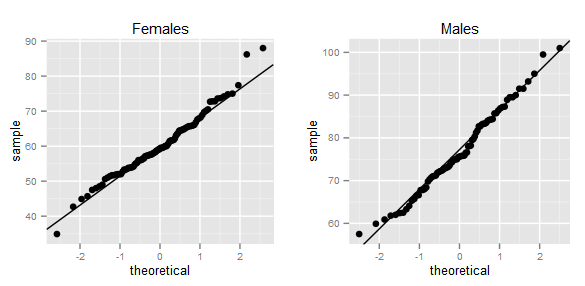
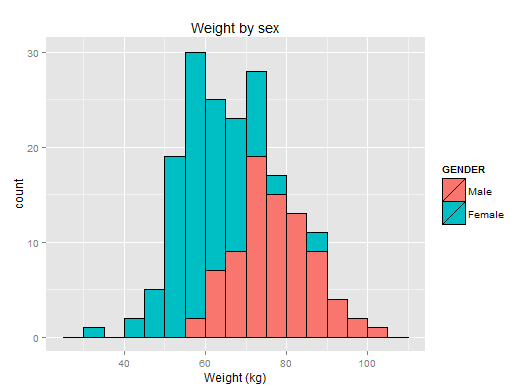 We can definitely see a difference between males and females. Furthermore, the data looks normally distributed. A qqplot can confirm this:
Since our data meets the assumptions of both the t-test and Mann-Whitney, we have to decide which to use. Or do we? Take a look at the results:
#Mann-Whitney is also called Mann-Whitney-Wilcox
#hence wilcox.test

> wilcox.test(BAWPOS ~ GENDER,data=weight)

	Wilcoxon rank sum test with continuity correction

data:  BAWPOS by GENDER
W = 7335, p-value < 2.2e-16
alternative hypothesis: true location shift is not equal to 0

> t.test(BAWPOS ~ GENDER,data=weight)

	Welch Two Sample t-test

data:  BAWPOS by GENDER
t = 12.1331, df = 164.236, p-value < 2.2e-16
alternative hypothesis: true difference in means is not equal to 0
95 percent confidence interval:
 13.87739 19.27207
sample estimates:
  mean in group Male mean in group Female
            76.76173             60.18700
As it turns out the Mann-Whitney test’s power efficiency is about 95% for moderately-sized data sets. This makes your life easy! In almost all cases, you will be fine using the Mann-Whitney test.
So you can see that while the t-test is appropriate in some situations, it’s requirement of normality is so critical that there are many times it will not work correctly. Always check the assumptions and when in doubt you’re less likely to fail with a non-parametric test!