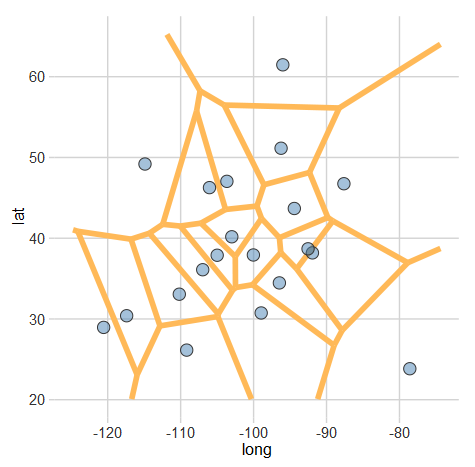
Last week I described how Voronoi diagrams can be created in R. Using that technique (and some heavy post-processing in Photoshop), I created this Voronoi diagram of the NCI-designated Cancer Centers in the U.S. According to the website, these centers…
Creating Voronoi Diagrams with ggplot

A Voronoi diagram (or tessellation) is neat way of visualizing spatial data. It essentially allows us to see the areas that are closest to a set of locations. For example, this map shows all of the Criagslist localities and the…
