K-12 Schools in the United States Mapped
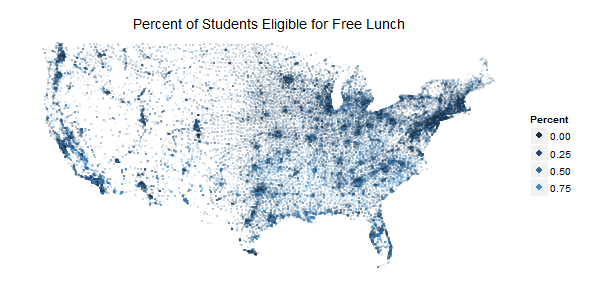
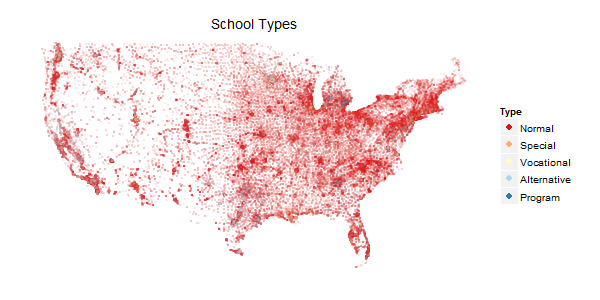
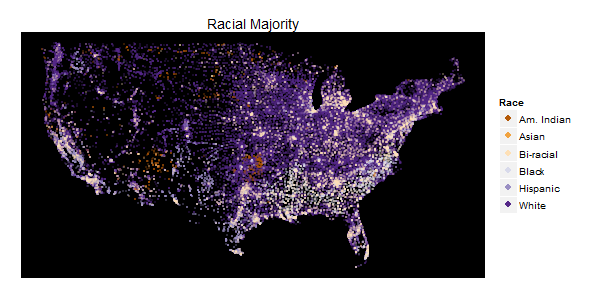
I’ve recently been seeing a lot of maps where things like tweets or McDonald’s locations are geocoded and plotted onto a map on the United States. Unfortunately, they usually all end up looking the same. We can see where the major population centers and roads are and not much else. Nonetheless, it is still kind of neat to see the U.S. “pop” into place without plotting cities or roads. When I recently downloaded a data set from the Department of Education, I was happy to see that the schools were geocoded. I had no choice but to create one of these maps! There was the instant “Woah that’s cool” followed by “Well…I’ve seen this before” followed by “What else can I do with this?”. Below is a series of maps I created by adding colors to the plots. Each one links to a much higher resolution (4000px X 2000px) image. In general, I think the small images give you nice general overviews while the large images let you drill down to the city level. All plots were created with the ggplot2 package for R.
Free Lunch
Some students are eligible for free lunch based on economic needs. This shows the percentage of students at each school who are eligible. See my other post for more data about this program.
School Type
The DOE codes schools according to one of five types: Regular school, Special education school, Vocational school, Other/alternative school, Reportable program (new code starting in 2007–08). Louisiana and Michigan really stand out to me in this one.
Racial Plurality
The DOE asks for schools population counts in the following categories: American Indian/Alaska Native, Asian, Hispanic, Black, White, Hawaiian Native/Pacific Islander, and Two or more races. I know there are a lot of problems with categorization this simple, but I think it can still give us a good snapshot of the U.S. population. The color of each point is determined by the population with the greatest plurality at the school. There are the traditional Black “crescent” in the South and Hispanic populations in the South. However, I found the “American Indian” and “Two or more races” data to be most interesting. I also chose to plot this on black, it seemed to pop a little better.
Where’s the love for Alaska and Hawaii? To be honest, I did try a few plots with them shrunk into the corner, but it really didn’t look appealing. Alaska is so sparse the points weren’t very visible and in contrast Hawaii is so small there isn’t much to see. This is the basic code I used to generate a map. Feel free to use and change as you’d like.
library(ggplot2)
pessus<-read.csv("pessus.csv")
pessus48<-subset(pessus,pessus$LONCOD09>-150&LATCOD09<50&LATCOD09>20)

#FREE LUNCH
png("map.png",width=4000,height=2000)
ggplot(pessus48,aes(x=LONCOD09,y=LATCOD09,color=FRELCHPCT))+
    geom_point(alpha=.75,size=1)+
    theme(axis.ticks=element_blank(),
          line=element_blank(),
          panel.background=element_blank(),
          axis.title=element_blank(),
          axis.text=element_blank(),
          text=element_text(size = 36))+
    labs(title="Percent of Students Eligible for Free Lunch")+
    guides(color=guide_legend(override.aes=list(size=15,alpha=1)))+
    scale_color_continuous(name="Percent")
dev.off()

#SCHOOL TYPE
png("type.png",width=4000,height=2000)
ggplot(pessus48,aes(x=LONCOD09,y=LATCOD09,color=factor(TYPE09)))+
    geom_point(alpha=.75,size=1)+
    theme(axis.ticks=element_blank(),
          line=element_blank(),
          panel.background=element_blank(),
          axis.title=element_blank(),
          axis.text=element_blank(),
          text=element_text(size = 36))+
    labs(title="School Types")+
    guides(color=guide_legend(override.aes=list(size=15,alpha=1)))+
    scale_color_brewer(name="Type",palette="RdYlBu",type="diverging",
                       labels=c("Normal","Special","Vocational","Alternative","Program"))
dev.off()

#RACIAL PLURALITIES
#Note: MAXRACE was calculated by myself in Excel
png("race.png",width=4000,height=2000)
ggplot(pessus48,aes(x=LONCOD09,y=LATCOD09,color=factor(MAXRACE)))+
    geom_point(alpha=1,size=2)+
    theme(axis.ticks=element_blank(),
          line=element_blank(),
          panel.background=element_rect(fill="black"),
          axis.title=element_blank(),
          axis.text=element_blank(),
          text=element_text(size = 36))+
    labs(title="Racial Plurality")+
    guides(color=guide_legend(override.aes=list(size=15,alpha=1)))+
    scale_color_brewer(name="Race",type="diverging",palette="PuOr")
dev.off()


