Will I Get Rained On?
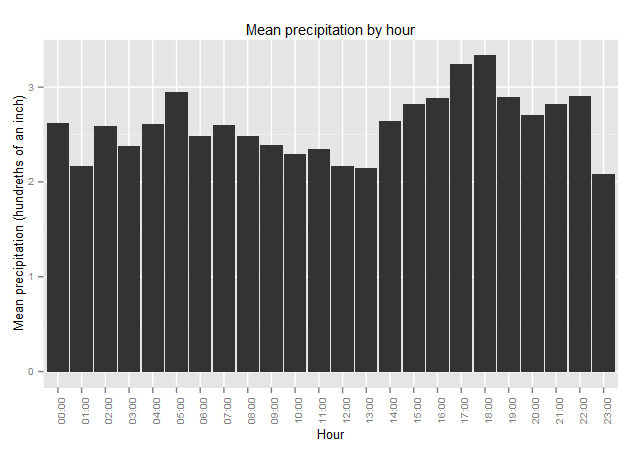
I’m a bike commuter and while I really enjoy it, getting rained on is a little bit annoying. This is actually something that people are most concerned about when they learn I commute by bike, but honestly, it doesn’t happen that frequently. I was curious to see just how common it is for me to get rained on. Getting data for this was shockingly easy. NOAA has a climate data website where you can choose from hundreds of datasets (with filters!) and download them within a few minutes. I chose the “Precipitation Hourly” dataset, chose my location, and filtered by the last ten years of data. (There is a disclaimer saying that some data preparation could take a few days and/or may incur a fee, but my data was done automatically and was ready within a few minutes via email.) According to Wikipedia, moderate rain is >0.098 inches per hour and that’s the rain that usually starts to soak into the clothing. I also only commute during the 7:00A and 4:00P hours of the day. Over the past ten years, only 6.9% of the datapoints met these conditions. Additionally, since I don’t work seven days a week, my chance of getting rained on is probably about 4-5%. (Technically, “precipitated on” is more accurate since winter rain in Ohio is rare.) Something that I’ve noticed anecdotally is that it’s more likely for me to get caught in the rain on the way home than it is on my way into work. The data showed that rain in the late afternoon and evening is more common than rain in the morning.
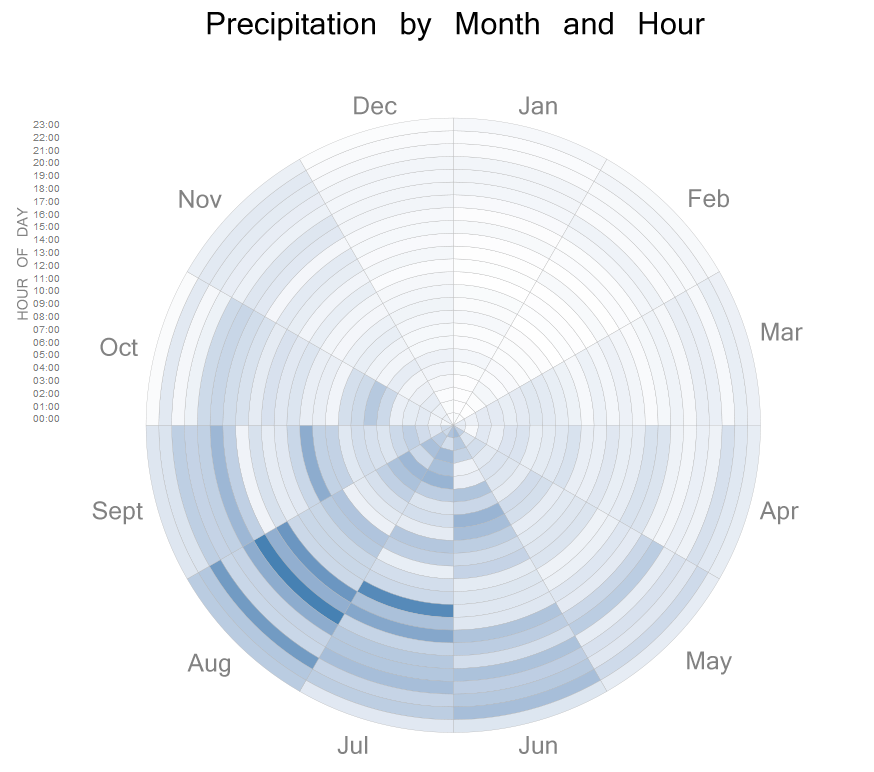
However, I couldn’t really find any information online as to why this may be the case, so it may just be a fluke. Although not a new idea, I really like heat maps for climate data. This is a heat map wrapped in a circle using ggplot2’s coord_polar() function that shows the month and hour of day. The innermost ring is the midnight hour and the outermost is 23:00. Darker shades indicate more precipitation.